Here is what the system shows about performance and what it does not. The performance room shows what actually went out: publishing days, creative counts, and formats per campaign, filtered by Facebook or Instagram. Impression and engagement numbers live in Meta's tools, on the page and the account that remain yours, and we do not invent numbers that did not come from there.
We didn't find an answer for that search. Try another word, or ask the bot below.
Measurement is spread across four places: the performance room in the Smart studio (performance per campaign), the measurement and insights tab in the paid campaign center, the organic performance card on Live now (including follower demographics), and performance chips on every published creative in the calendar. In addition, the snapshot at the top of the board shows an impressions summary of the last 30 days.
1
In the snapshot at the top of the board: a 30 day impressions tile sums both channels. Clicking it leads to the Live now screen.
2
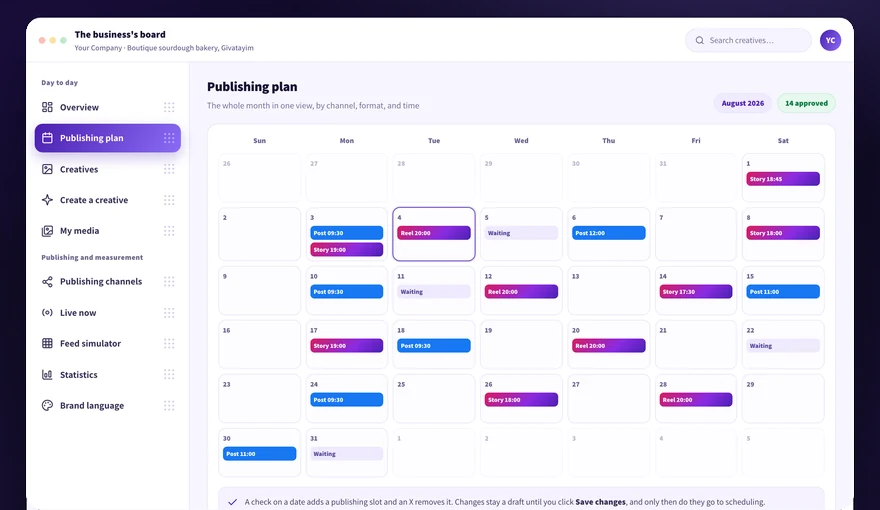
In the publishing calendar: open a day that was already published, and above each creative its impressions, clicks, likes, and comments are shown.
3
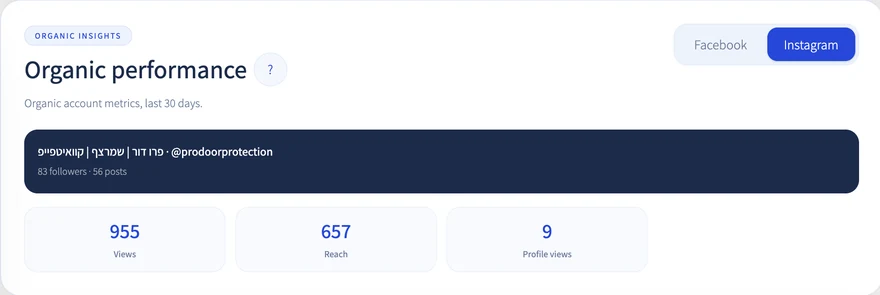
On Live now: an organic performance card with impressions, reach, views, and demographics.
4
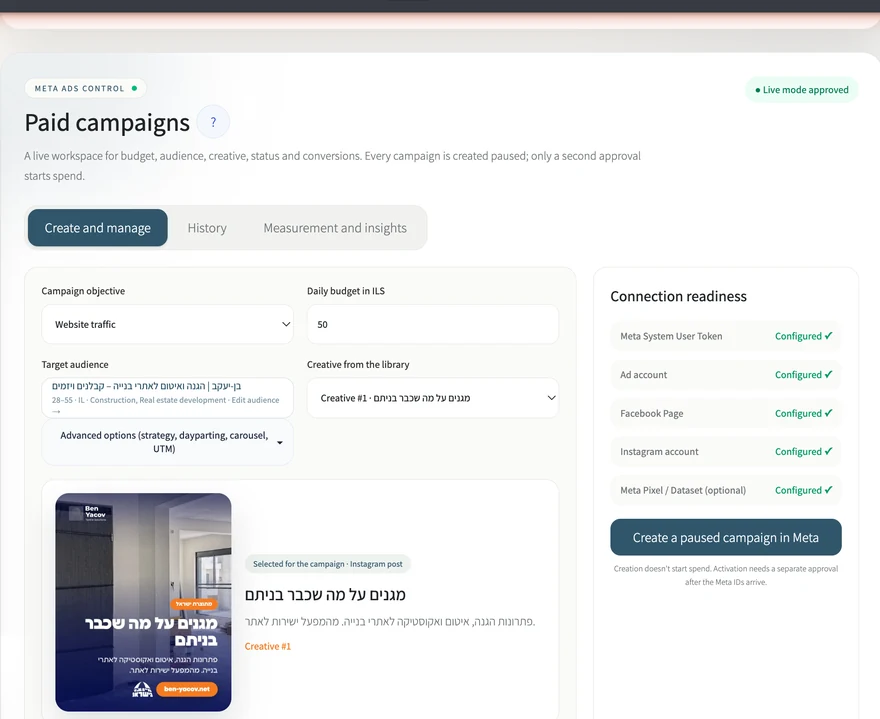
In paid campaigns: a measurement and insights tab with impressions, clicks, cost, and conversions per campaign.
Some Meta metrics (impressions and breakdowns) are shown only after the connected account's permissions were approved. Likes and comments are shown already with a basic connection.
Open in the publishing calendar the day the post was published: above every published creative appear performance chips with impressions, clicks, likes, and comments, straight from Meta.
1
Open the publishing calendar and click a day with a green dot (published).
2
On every published creative's card a small metrics row is shown: 👁 impressions, 🖱 clicks, ❤️ likes, 💬 comments.
3
If some of the metrics do not appear, usually their permission has not been approved yet on the connected account; whatever is available is always shown.
The metrics are pulled live from Meta for posts published through Kampi. More detailed engagement, including replying to comments, lives in the engagement inbox.
In the performance room there is a button that shows demo numbers, to get a feel for how the screen looks when full. Those numbers are marked as a demo and are not your business's data.
1
Click show performance demo to see how the screen looks with data in it.
2
Remember that all the numbers in this mode are an example and not real data.
3
Click exit demo mode to return to what really went out.
4
Go to Meta's tools when you need a real number.
We will not present demo data as real data. Until the Meta connection pulls data, the screen shows what was planned and actually went out.
The one steering next month's plan is you. The system does not learn from your corrections and does not change the plan on its own.
1
Go over in the performance room what actually went out in the past month.
2
Check in Meta's tools which publications got a response.
3
Change the publishing days, the gap, or the time on the frequency screen if needed.
4
Approve more creatives of the kind that worked for you, because the approval order decides what goes out.
5
Upload more raw material of the kind that succeeded to the library.
The system does not learn and does not improve on its own over time. The decisions stay with you.
In the first days it is natural to see an almost empty screen. The performance room fills from what already went out, and data from Meta appears only when the connection is active.
1
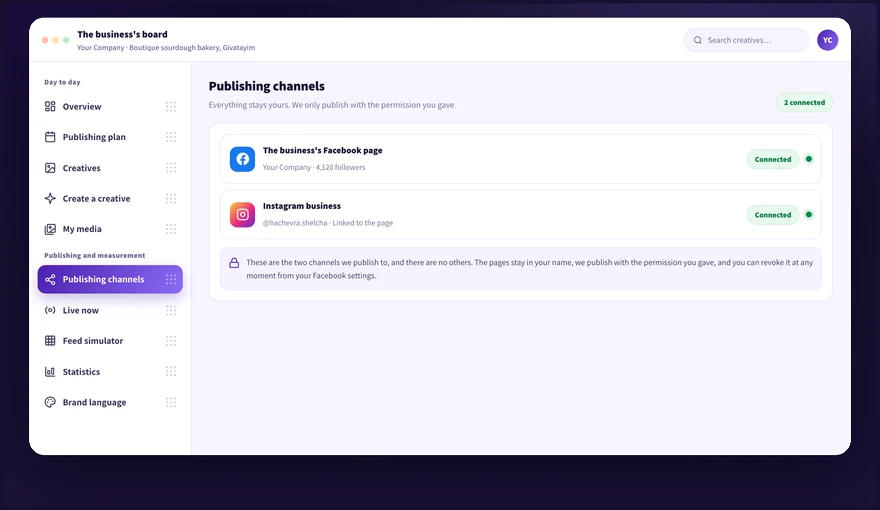
Open Publishing channels and check that the dot next to each channel is green.
2
Reconnect a channel with a red dot, with admin permission.
3
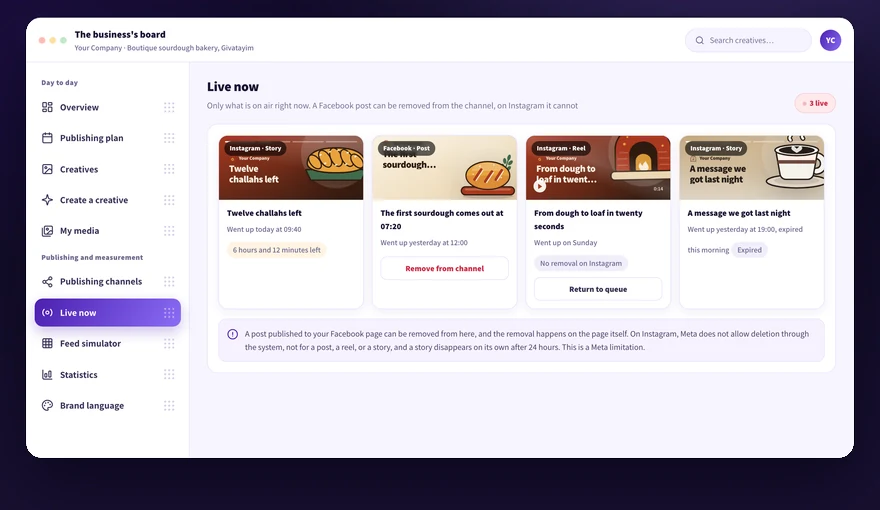
Check on Live now that there is content that already went out.
4
Wait a few hours after publishing, because measurement updates with a delay.
5
Contact us at 054-5082696 or by email at info@kampi.co.il if a few days passed and the screen is still empty.
While the channel is disconnected the system does not pull new data. After reconnecting it is worth checking again.
The organic performance card on the Live now screen shows the account's metrics over the last 30 days, straight from Meta: on Facebook impressions, engagement, page views, and new followers; on Instagram reach, profile views, and a follower breakdown by age and gender.
1
Open Live now and find the organic performance card. Choose a channel in the tabs.
2
The dark row shows the account and the current follower count. The numbers below it sum the last 30 days.
3
On a business Instagram a demographic breakdown of the followers by age and by gender is also shown, in comparison columns.
4
If a message appears that some metrics are unavailable, the reason is usually a non-professional account or a permission not yet approved. The available metrics keep showing as usual.
These are the account's organic metrics. Paid campaign performance is shown separately, in the campaign center's measurement and insights tab.
Didn't find it? Ask us
The bot knows the whole help center. If it doesn't know, it hands you over to us with a summary of what you already tried.